Applications Note: NM250002E
Currently, JASON1 SMILEQ2 supports the generation of two types of analytical reports based on quantitative analysis results. These reports offer comprehensive insights into the interpretation of quantitative data. As part of the background, this application note provides an overview of the factors contributing to uncertainty and their significance in quantitative NMR analysis. The main focus lies in presenting an overview of SMILEQ reports and offering an in-depth explanation of the 'Uncertainty Report.' Parts 2 and 3 delve deeper into the findings presented in the Uncertainty Report, transitioning into variance analysis to examine uncertainties arising from factors not covered in the report. Additionally, these sections showcase examples illustrating the application of variance analysis and the evaluation of uncertainty factors.
Factors of Uncertainty in Quantitative NMR Analysis and Their Significance
The factors contributing to uncertainty in quantitative NMR analysis results can be grouped into three main categories (Figure 1). These categories have a substantial impact on overall uncertainty, emphasizing the importance of addressing each one thoroughly and continually working towards their evaluation and refinement.
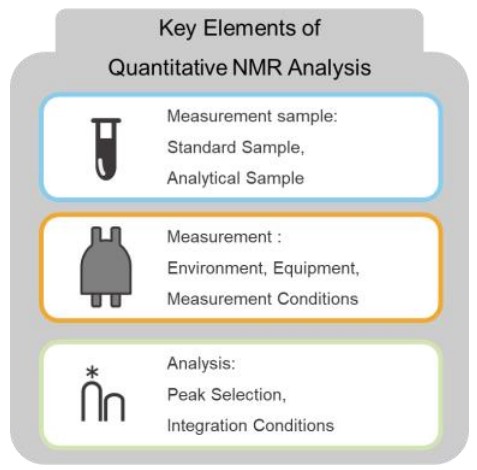
Figure 1. Key Elements of Quantitative NMR Analysis |
Factors of Uncertainty: Key Points for Each Factor
- Standard Samples: The purity and stability of samples are significant contributors to uncertainty.
- Analytical Samples: Preparation methods, storage conditions, and physical properties (e.g., homogeneity) play a critical role in affecting uncertainty.
- Environment: External conditions, including temperature, humidity, and vibrations, may influence measurement results.
- Equipment: Device-specific errors can significantly contribute to uncertainty factors.
- Measurement Conditions: Reproducibility of experimental procedures and variations in operational conditions directly impact uncertainty.
- Peak Selection: The accuracy and consistency of peak selection greatly influence the reliability of analysis results.
- Integration Conditions: Settings for integration ranges and baseline strongly affect the outcomes. Additionally, proper measures to minimize noise effects are essential.
|
SMILEQ Reports for Comprehensive Evaluation of Quantitative Analysis Results
SMILEQ generates two types of reports for evaluating quantitative analysis results (Figure 2):
- Uncertainty Report:
This report complies with ISO 24583. It acts as a reliability-focused analytical tool, providing a comprehensive evaluation of uncertainties throughout the measurement process.
- ANOVA Report:
This report employs variance analysis to deliver detailed insights into quantitative analysis results. It offers a systematic approach to isolating and clarifying the contributions of individual factors—such as samples and signals—to the overall data.
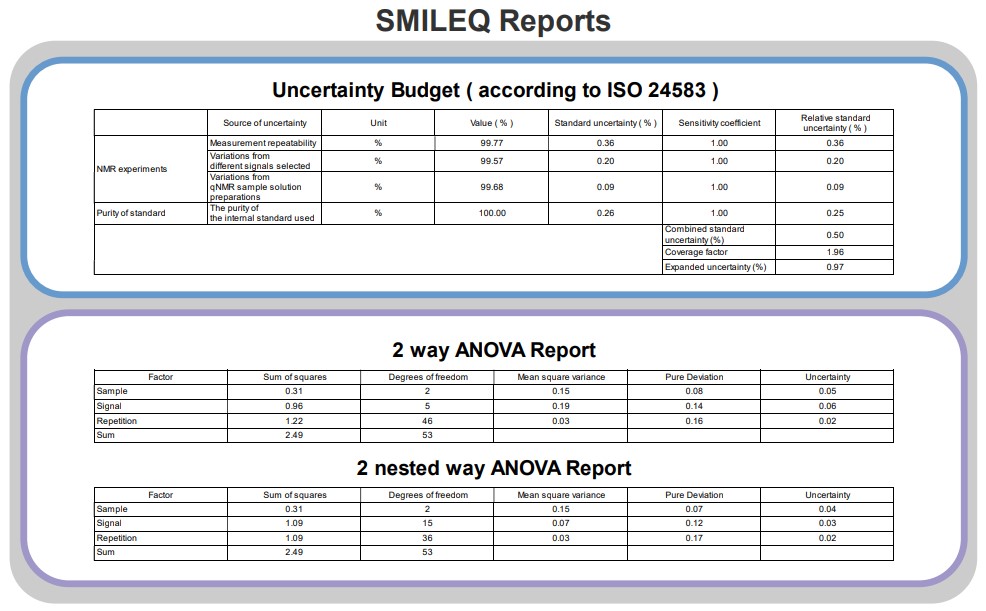
Figure 2. SMILEQ Reports
SMILEQ Reports: Key Features
The key features of SMILEQ reports are summarized in Table 1. These reports play a vital role in evaluating quantitative analysis results through two complementary tools:
-
Uncertainty Report This tool provides an integrated evaluation of uncertainties throughout the entire measurement process. With a reliability-focused and comprehensive perspective, it effectively clarifies overall uncertainty and supports decision-making processes.
-
ANOVA Report Based on variance analysis, this report isolates and quantifies uncertainties arising from individual factors, such as samples and signals. It offers detailed insights into the contributions of each element, enabling a deeper understanding of data structures.
Significance of Combined Use By combining these two reports, the following benefits can be achieved:
-
Conduct comprehensive risk assessments based on total uncertainty.
-
Gaining a deeper understanding of data structures through variance analysis.
-
Clarifying the factors contributing to uncertainty in quantitative analysis results.
For example, comparing archived Uncertainty Reports using expanded uncertainty values allows for an evaluation of experimental validity. If issues arise with expanded uncertainty, variance analysis results can be utilized for detailed root cause analysis.
Thus, SMILEQ reports are invaluable not only for improving data analysis accuracy but also for enhancing the overall experimental process. By addressing uncertainties methodically and comprehensively, these reports contribute to advancing both measurement reliability and experimental efficiency.
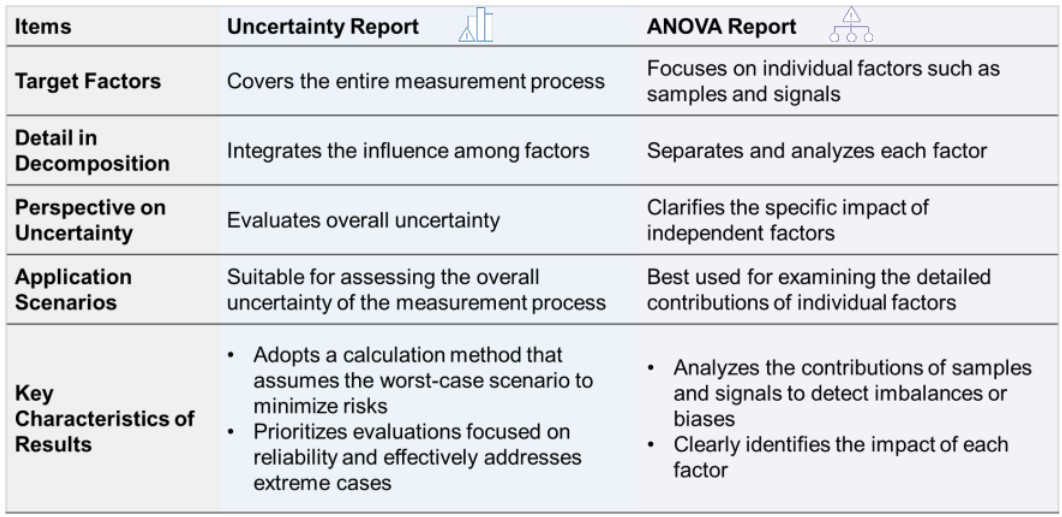
Table 1. Key Features of the Uncertainty Report and ANOVA Report
Details of the Uncertainty Report
The Uncertainty Report outputs Relative Standard Uncertainty (%) for the following factors in quantitative NMR analysis. Relative Standard Uncertainty serves as an indicator to evaluate how each element contributes to the measurement results.
-
Measurement Repeatability Evaluates variability in reproducibility under identical conditions.
-
Variations from Different Signals Selected Assesses impacts of signal selection differences on results.
-
Variations from qNMR Sample Solution Preparations Variations originating from the sample solution used in measurements.
-
The Purity of the Internal Standard Used Reflects variability due to purity and stability of the standard used.
Combined Standard Uncertainty (%) is calculated by aggregating the Relative Standard Uncertainty of each factor. Furthermore, Expanded Uncertainty (%) is derived by applying a Coverage Factor, which is set based on the confidence level. The Coverage Factor is a statistical coefficient used to expand the uncertainty and define the confidence interval. For example, at a 95% confidence level, the Coverage Factor is set to approximately 1.96. Figure 3 illustrates the metrics included in the Uncertainty Report and provides their respective explanations.
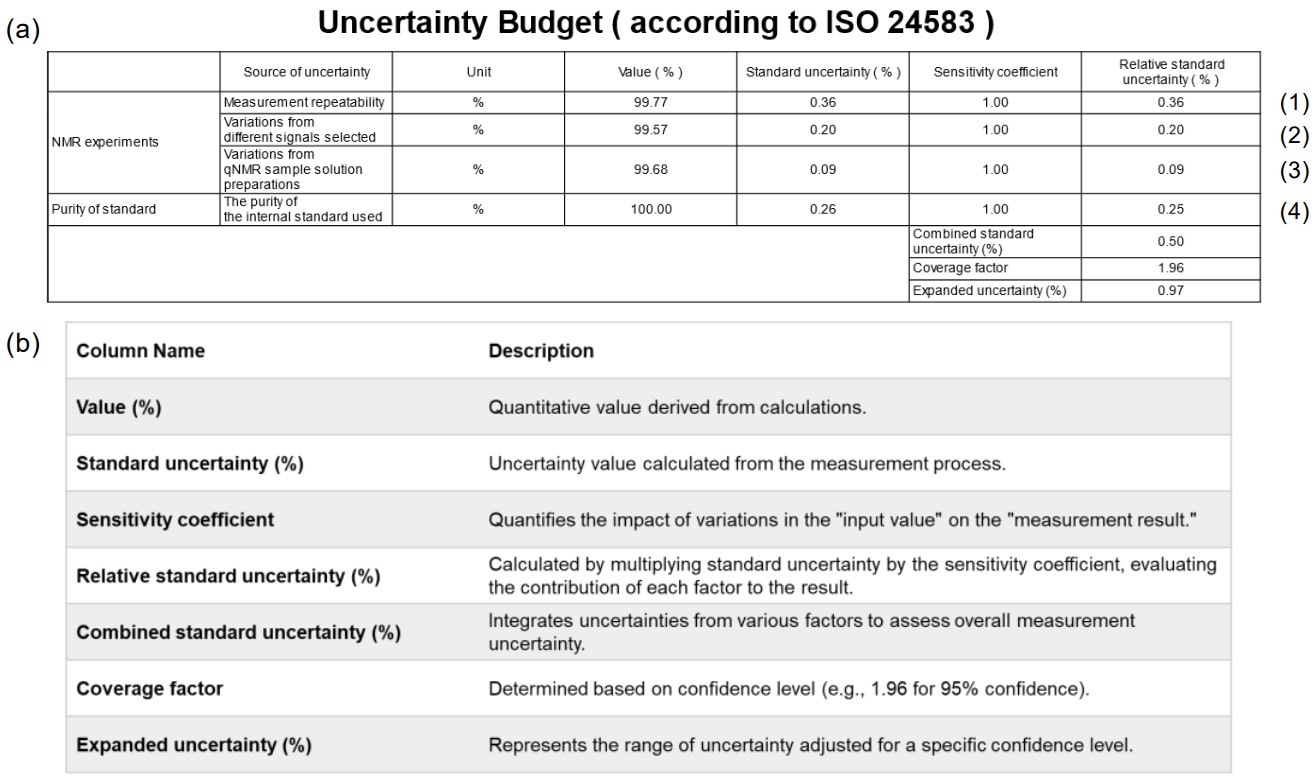 Figure 3. Uncertainty Report: (a) Uncertainty Budget, (b) Metrics and Descriptions
Expanded Uncertainty and Confidence Range
The Expanded Uncertainty, as presented in the Uncertainty Budget, is a key metric for evaluating the reliability of measurement results and assessing the validity of experimental outcomes.
The value obtained for a 95% confidence level in the Expanded Uncertainty (e.g., 0.97% from Figure 3(a)) represents a comprehensive evaluation of uncertainty across the entire measurement process. For a mean measurement value of 99.68%, the true value is interpreted to lie within a range of ±0.97% around this mean. This metric serves as a critical indicator in determining experimental reliability and trustworthiness.
Figure 4 provides an illustration of the quantitative data distribution within the dataset from Figure 3(a), along with its confidence interval. The orange line represents a Gaussian distribution curve derived from the dataset's histogram. It was confirmed that all quantitative values obtained from the experimental data fall within the confidence interval, reinforcing the robustness and reproducibility of the measurement process.
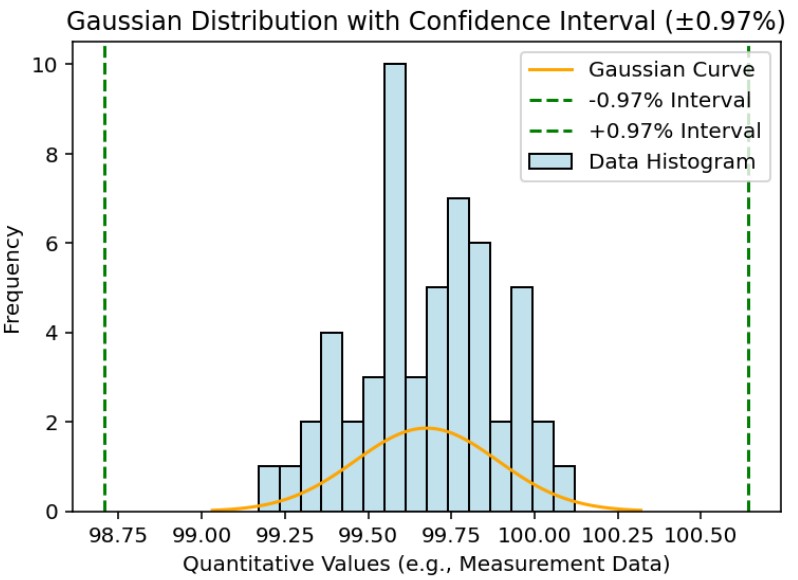
Figure 4. Gaussian Distribution and Confidence Interval in Quantitative Results
Insights from the Uncertainty Report: Contribution Ratio
The contribution ratio is a metric that quantifies how each factor's relative standard uncertainty impacts the combined standard uncertainty of the measurement process. This metric enables a clear evaluation of how significantly each factor contributes to overall uncertainty. The contribution ratio is calculated by dividing the square of the relative standard uncertainty by the square of the combined standard uncertainty, then multiplying the result by 100. This calculation expresses each factor's contribution as a percentage. Figure 5 illustrates the contribution ratios derived from the Uncertainty Report. The following trends can be observed from the contribution rates in Figure 5(b):
-
Measurement Repeatability Identified as the largest contributor, the standard deviation of repeated measurement data serves as the primary source of uncertainty.
-
Internal Standard The certified values of the standard sample consistently influence the overall data reliability.
-
Signal and Sample Although their contribution rates are relatively small, there is potential for further improvements to minimize their effects on uncertainty.
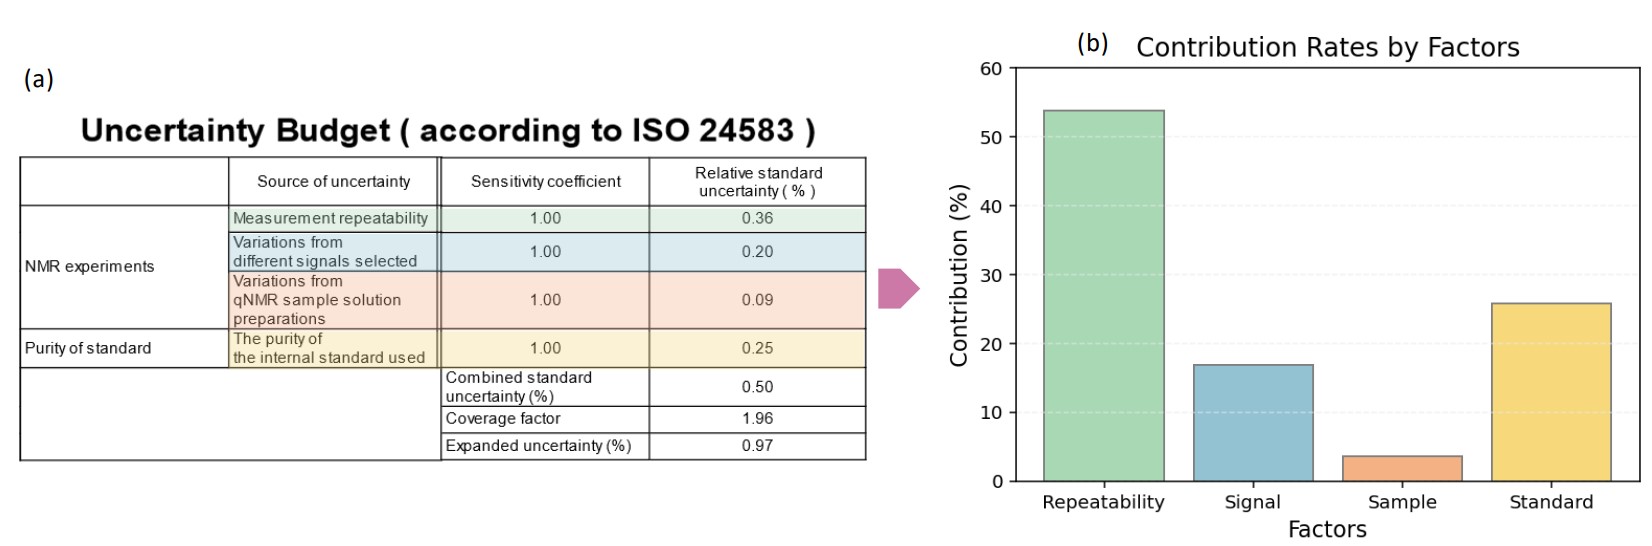
Figure 5. Contribution Rates: (a) Example of Uncertainty Report, (b) Contribution Ratios for Individual Factors
From Uncertainty Report to Variance Analysis
The Uncertainty Report calculates uncertainties that comprehensively reflect the impact of each factor on the entire measurement process. A key feature of this approach is that uncertainties are calculated without separating the mutual interactions between factors or variations in the overall data. This enables a holistic evaluation of uncertainties across the measurement process. In contrast, Variance Analysis (ANOVA) isolates pure deviations for each individual factor. By eliminating mutual interactions, it clearly quantifies the extent to which each factor contributes to errors. Based on these analyses, specific improvement measures can be formulated to address particular factors. Furthermore, leveraging the results of the ANOVA Report provides a more detailed breakdown of error factors and contribution rates. Details of this analysis are discussed further in "Part 2. Analysis of Factors through Variance Analysis."
For the latest topics and detailed information on quantitative NMR, please refer to Quantitative NMR (qNMR) on our corporate website.
[1] JEOL Analytical Software Network
[2] Spectral Management Interface Launching Engine for Q-NMR