The HECADE-HSQC experiment is specifically designed to measure heteronuclear scalar couplings such as nJCH and nJNH. While many methods can determine the magnitude of these couplings, HECADE is amongst the few that can also provide the sign of the coupling constant. Knowing the sign can be particularly helpful when determining molecular structure. For example, one-bond and three-bond CH couplings are generally positive, whereas two-bond and four-bond couplings may be either positive or negative. This distinction further aids in structural elucidation.
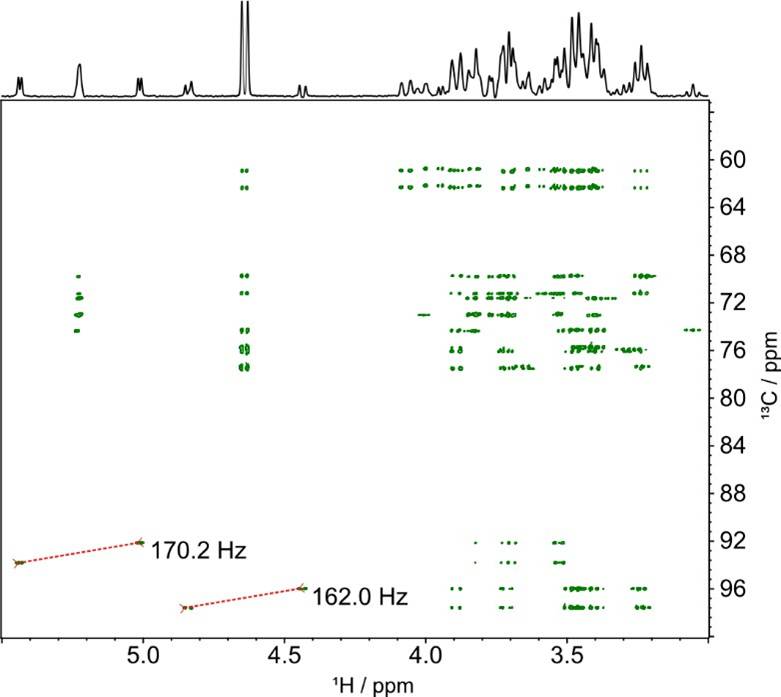
Fig. 1 HECADE – HSQC spectrum for a mixture of a mixture of a- and b- glucose acquired on a 400 MHz JEOL ECZL spectrometer with a 5mm ROYALPROBETM HFX
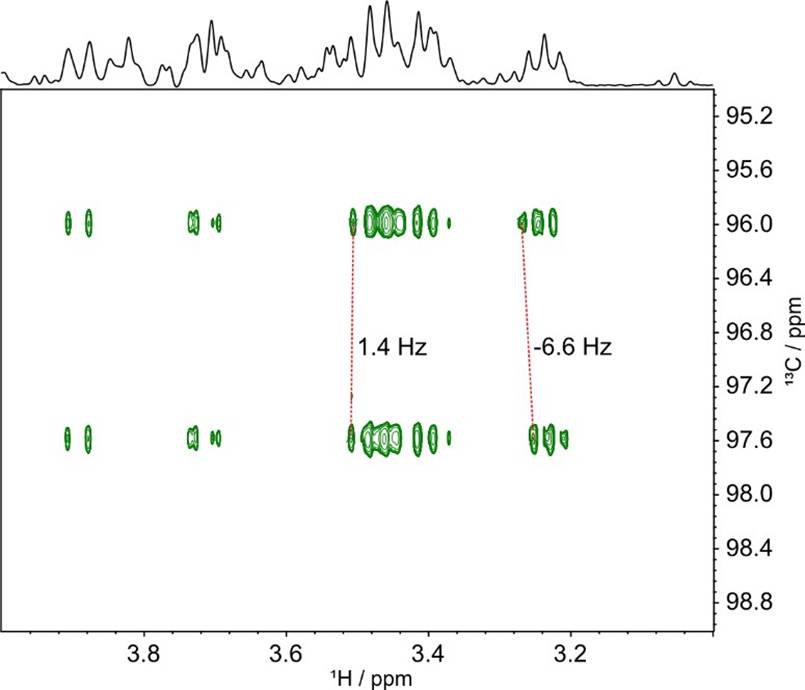
Fig. 2 Expansion of the HECADE – HSQC spectrum shown in Fig. 1 showing the long range JCH correlations from C1 to H2 and H3 of b -D-glucose
In a HECADE-HSQC spectrum, the sign of the coupling is indicated by the tilt of the peaks (as shown in Fig. 1). Peaks that tilt like a forward slash (“/”) represent positive couplings, while those tilting like a backslash (“¥”) represent negative couplings. The separation of peaks along the F1 dimension (the indirect dimension) corresponds to the large one-bond coupling.
Incorporating an isotropic mixing element into the experiment, that shares the magnetisation from one nucleus to each nucleus within a scalar coupled network allows for long range CH couplings to be measured via the signal separation in F2 (the direct dimension). For example, Fig. 2 shows an expansion of the data shown in Fig. 1 focusing on C1 of -D-glucose. The coupling of C1 – H2 (2JCH) is -6.6 Hz and the C1 – H3 coupling (3JCH) is 1.4 Hz.
Measuring Homonuclear Couplings
Homonuclear 1H couplings hold equally rich structural information, but their extraction is often complicated by the narrow proton chemical-shift range and extensive multiplet overlap in 1H spectra.
PSYCHE-2DJ,2 an extension of the pure-shift PSYCHE method that suppresses homonuclear scalar couplings so that each chemical shift is ideally represented by a singlet, allows homonuclear scalar couplings to be measured in F1. In Fig. 3, PSYCHE-2DJ is applied to a mixture of α/β-D-glucose producing an F2 projection in which overlapping multiplets are collapsed into well-resolved singlets. Because all coupling information is retained, individual couplings can then be extracted.
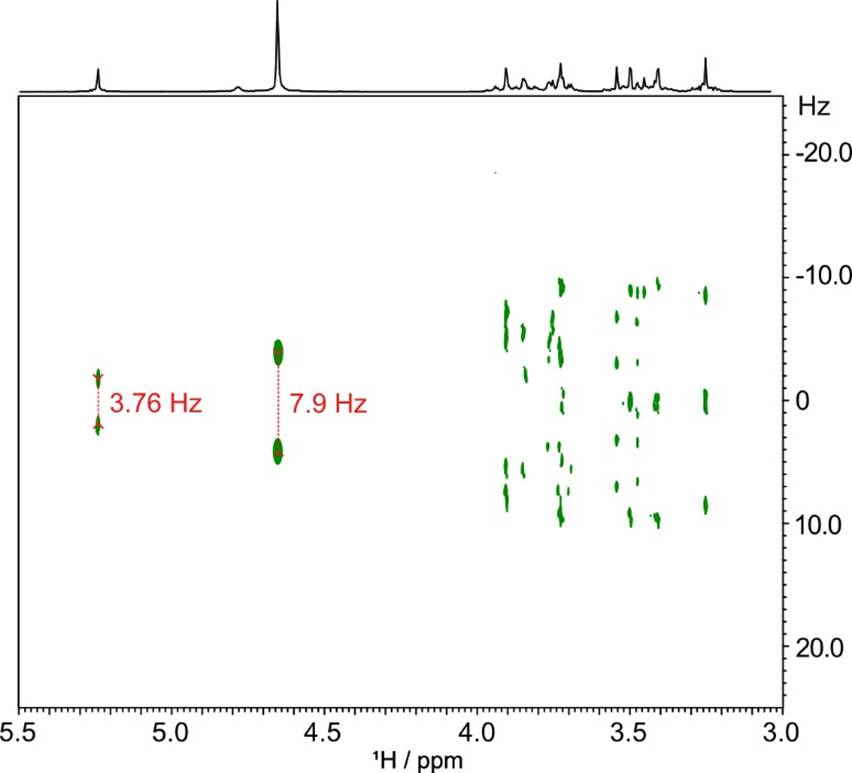
Fg. 3 PSYCHE-2DJ spectrum of a mixture of /-D-glucose
However, even pure-shift techniques face challenges when strong overlap persists, particularly in the congested 3–4 ppm region. Various approaches have been proposed to simplify the extraction of homonuclear couplings, including G-SERF and PSYCHEDELIC.3 Both yield the full set of couplings associated with a selected resonance, with PSYCHEDELIC often providing higher sensitivity. Fig. 4 illustrates the 2D PSYCHEDELIC method applied by selecting the H1 resonance of α-D-glucose, where the separation in the F1 dimension corresponds to the 3J(H1–H2) coupling of 3.76 Hz. As only couplings to selected nuclei are retained multiple experiments are typically required, one per region of interest with the condition that each region does not contain mutually coupled pairs of nuclei.
A drawback of these methods is the presence of strong axial peaks, which can obscure nearby couplings. Dong et al.4 introduced a simple processing scheme for PSYCHEDELIC-type data that effectively suppresses these artifacts. This method is summarised in Equation 1, where SN/R represent the Normal and J-reversed spectra, respectively, and * denotes the complex conjugate.
Snew = (SN-SR) (SR-SN)
In contrast to the experiment used by Dong, we employ a triple spin-echo version of PSYCHEDELIC, which provides cleaner spectra. All processing is performed directly within the JASON* environment, avoiding the need for MATLAB post-processing. Applying the operation in Eq. 1 to the data in Fig. 4 produces the clean, axial-free spectrum shown in Fig. 5.
*JASON (JEOL Analytical Software Network)
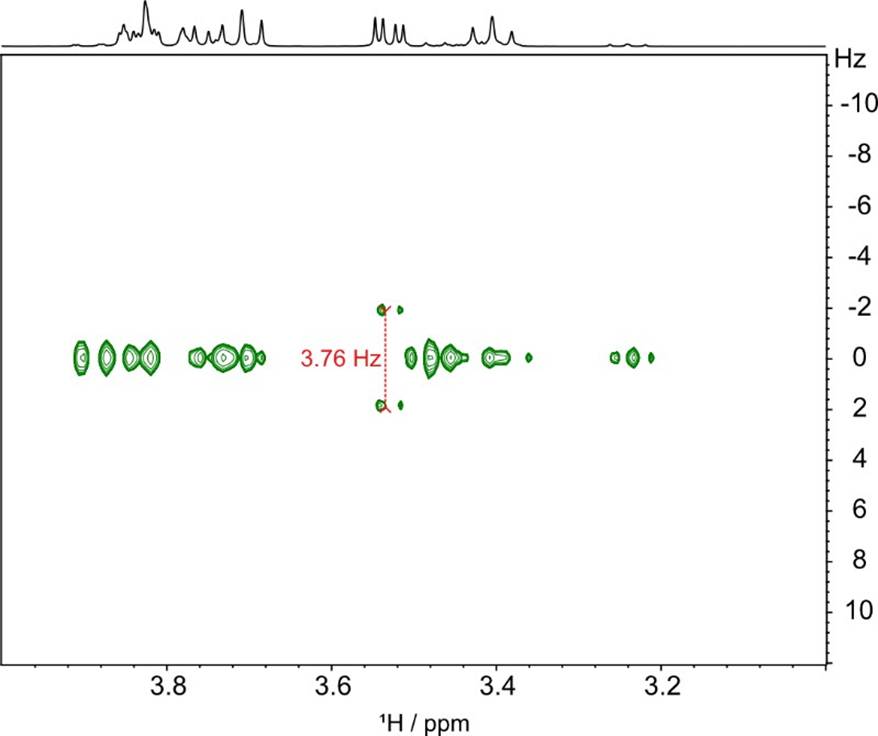
Fig. 4 Expansion of the PSYCHEDELIC Spectrum showing the region from 3 – 4 ppm. The H1 signal of -D-glucose was selected with a 80 Hz selective pulse (REBURP)
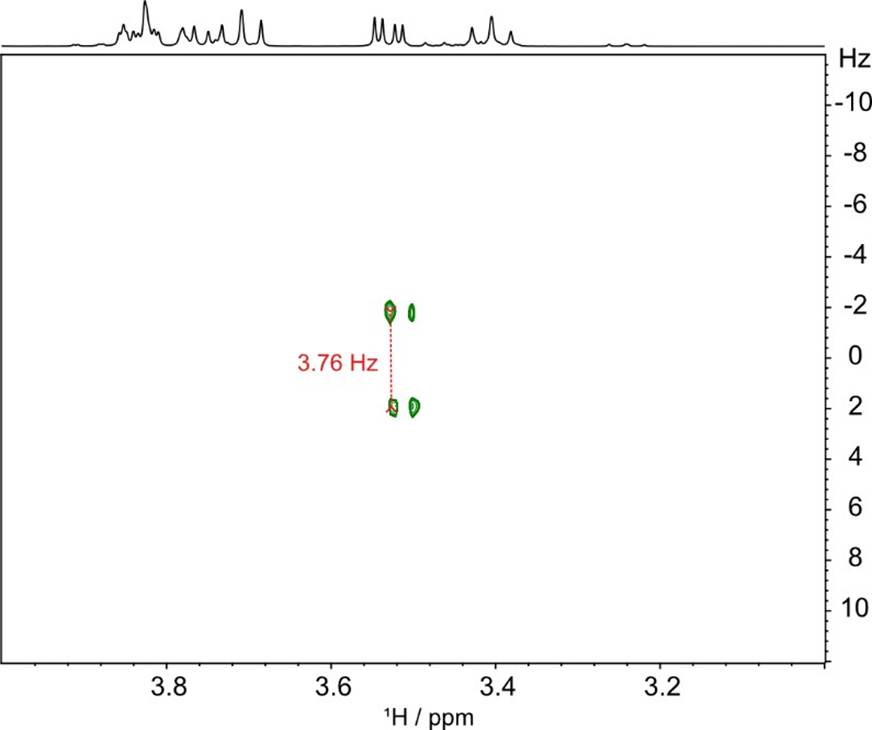
Fig. 5 The same data in Fig. 4 with the same expansion but with the processing summarised in Eq. 1 applied
References
- W. Koźmiński, D. Nanz, J. Magn. Reson., 1997, 124, 383-392
- M. Foroozandeh et al., Chem. Commun., 2015, 51, 15410-15413
- D. Sinnaeve, Angew. Chem. Int. Ed Engl. 2015, 55, 1090-1093
- X. Dong et al., J. Magn. Reson., 2021, 325, 10693