Resolution in SEM with Nanopix
The first commercially available SEM was introduced over 50 years ago and to this day there is still no internationally accepted standard procedure for determining the resolution in an SEM image. To add to the confusion, each SEM manufacturer relies on their own sample and methods for determining resolution. Defining the edge of a particle manually is also always subjective in nature; values will differ from one person to the next based on how that person interprets or ‘sees’ the edge of a particle.
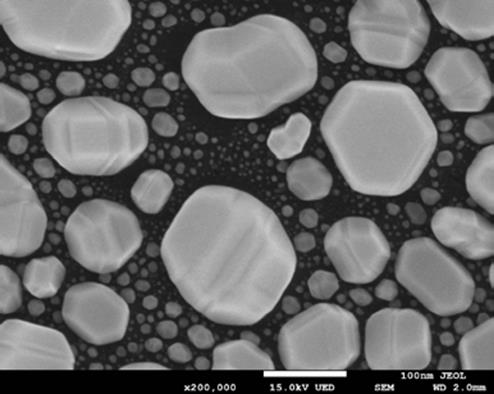
Figure 1: SEM image of a gold on carbon test sample
The International Organization for Standardization (ISO) has taken the guesswork out of determining resolution by publishing a Technical Specification [1] outlining three different acceptable methods for evaluating the sharpness in a digitized SEM image via computer algorithms. Using the Derivative (DR) Method, JEOL has created Nanopix, a proprietary software which determines image sharpness by “fitting error function profiles to gradient directional-edge profiles of particles in an SEM image” [1]. The analysis is completed on a sample of small gold particles evaporated on a carbon substrate (Figure 1). The distance for the edge profiles of particles is considered to be related to probe diameter and thus resolution. JEOL uses the ISO convention which measures at the 75th and 25th percentile of this transition (Figure 2). Figure 3 shows a Nanopix analysis on the SEM image from Figure 1, resolving a resolution of 0.7 nm. Some SEM manufacturers reportedly use the 65th and 35th percentile which can lead to much lower reported values of resolution even from the same method. The values will also differ on the same image between the three different methods, depending on various factors such as brightness and contrast, contrast-to-noise ratio, and pixel size. Clearly, resolution specifications cannot be compared easily today between different manufacturers.

Figure 2: Edge profile of error functions for DR method

Figure 3: Nanopix measured resolution on the sample from Figure 1.
Since image acquisition and the actual measurement procedures can vary considerably between different microscope vendors, it is important to be mindful when relating and comparing resolution numbers. How the measurement is made and what sample and parameters are selected can have a profound impact on the resolution number reported.