Degradation analysis of polyethylene terephthalate film by UV irradiation using imaging mass spectrometry and scanning electron microscopy
Product: JMS-S3000, JSM-7200F
Introduction
Surface analysis equipment is commonly used to evaluate industrial material for information such as elements, bonding states, and functional groups on the sample surface. However, commonly used tools like scanning electron microscopes (SEM) are not able to provide the elemental composition or structural information about the organic compounds present in/on the sample. Conversely, organic mass spectrometry (MS) can provide this information for organic molecules on surfaces and in the bulk material. Among the MS techniques available, matrix assisted laser desorption/ionization (MALDI) mass spectrometry is a powerful tool for the analysis of synthetic polymers. By using MALDI with a high-resolution time-of-flight mass spectrometer and Kendrick mass defect (KMD) analysis, polymer materials can be quickly analyzed to identify differences in monomer, polymer end groups, and their molecular weight distributions. More recently, MALDI mass spectrometry imaging (MALDI-MSI) has been used to visualize the locations of compounds on sample surfaces, thus suggesting that it is possible to obtain polymer molecular information present on sample surfaces, which is not possible by conventional surface analysis methods like SEM. In a previous report [1], we showed the effects of ultraviolet (UV) irradiation degradation for polyethylene terephthalate (PET) spots. In this report, we have expanded MALDI-MSI to analyzing a PET film that was exposed to UV radiation. Additionally, a SEM was used to look at the morphological differences in the PET film before and after UV irradiation.
Experimental
A 30 µm-thick PET film was used for the sample. First, the right-half of the PET film was masked with aluminum foil, and then UV irradiated for 30 minutes using Handicure 100 (manufactured by Mizuka Planning Co., Ltd.).

Figure 1. Schematic of the irradiation region of PET film using ultraviolet ray.
2,4,6-Trihydroxyacetophenone (THAP) was used as the matrix, and sodium trifluoroacetate (NaTFA) was used as the cationizing agent. THAP and NaTFA were dissolved in tetrahydrofuran (THF) at concentrations of 10 mg/mL and 1 mg/mL, respectively. A THAP and NaTFA mixture (10:1 v/v) solution was sprayed on the PET film with an airbrush.
The MALDI-MSI measurements were done by using the JMS-S3000 in SpiralTOF positive ion mode. The pixel size for the MSI images was 50 µm. The msMicroImagerTM software was used for MSI analysis, and msRepeatFinder was used for KMD analysis. A JSM-7200F field emission scanning electron microscope (FE- SEM), was used to look at the surface morphology using the conditions listed in Figure 2.
Results
Figure 2 shows the secondary electron images for the PET film surface before (A, B) and after (C, D) UV irradiation. These results were obtained by SEM without coating the sample for analysis. In particular, secondary electrons emitted from the sample surface are sensitive to irregularities which makes it suitable for looking at changes in sample surfaces. Figures 2A and B show the secondary electron images before UV irradiation (magnifications of 50,000 and 100,000, respectively), in which the PET surface is smooth. On the other hand, Figure 2C and D show the secondary electron images after UV irradiation (magnifications of 50,000 and 100,000, respectively), in which surface irregularities of approximately 100nm were observed. These results show that SEMs are effective for observing changes in morphology and nanostructures on sample surfaces.
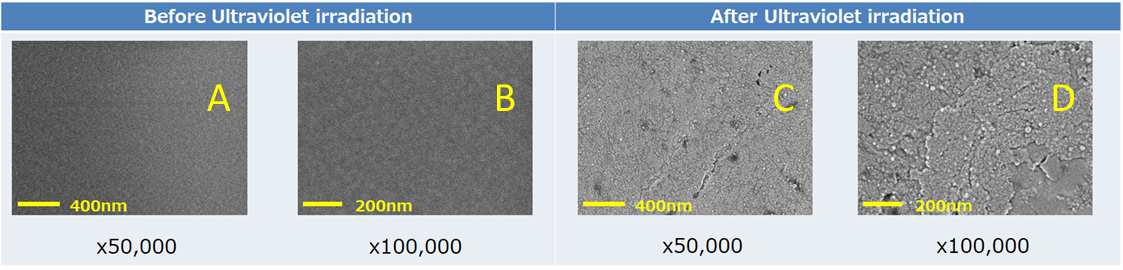
Figure 2. Secondary electron image of PET film surface before (A,B) and after (C,D) ultraviolet irradiation.
FE-SEM conditions were Acceleration voltage: 0.8 kV, Signal:Secondary electron image, Pretreatment:without coating.
Figure 3A shows the averaged mass spectrum for the entire measurement area. Figure 3B shows the C10H8O4 KMD plot for the average mass spectrum in which eight different PET series (192u intervals) were identified. Series I thru IV are exactly the same series observed previously in MSTips 307. These series were identified as sodium adduct ions for (I) cyclic oligomer, (II) COOH/COOH end groups, (III) cyclic oligomer + C2H4O, and (IV) COOH/OH end groups, respectively. Series I and III are components that were present before ultraviolet irradiation, and Series II and IV are the components that appear after ultraviolet irradiation. The Series I and II images (Figure 4A and 4B) were generated by summing the mass image intensities included in the KMD plot blue and red groups, respectively. The Series I ion intensities are relatively low in the irradiated side (left) so this means that UV irradiation reduces the presence of this series (Figure 4A). On the other hand, the Series II ion intensities are relatively high in the irradiated side (left) so this means that UV irradiation increases the presence of this series (Figure 4B). To show this degradation more clearly, Figure 4C normalizes Series II to Series I by ratioing their ion intensities (Series II/I) in each pixel. Figure 5 shows the Series II to VIII images using Series I for normalization (2×2 pixel binning). Figure 5 clearly shows that the Series III, V, and VIII, which have the same color tone for both the irradiated and unirradiated sections, are present in the sample regardless of UV irradiation. However, Series II, IV, VI, and VII show brighter color areas for the irradiated section of the sample, thus indicating that these PET series are generated by irradiating the surface with UV light.
Conclusions
In this report, we compared UV irradiated and non-irradiated PET thin films by using FE-SEM to observe morphology changes on the surface and MALDI-MSI to detect changes in molecular information on the film surface. Each technique provided complementary information about the UV degradation of a PET thin film.
References
- [1] MSTips 307 “Mass spectrometry imaging for degradation of polyethylene terephthalate by UV irradiation using JMS-S3000 "SpiralTOFTM-plus"”
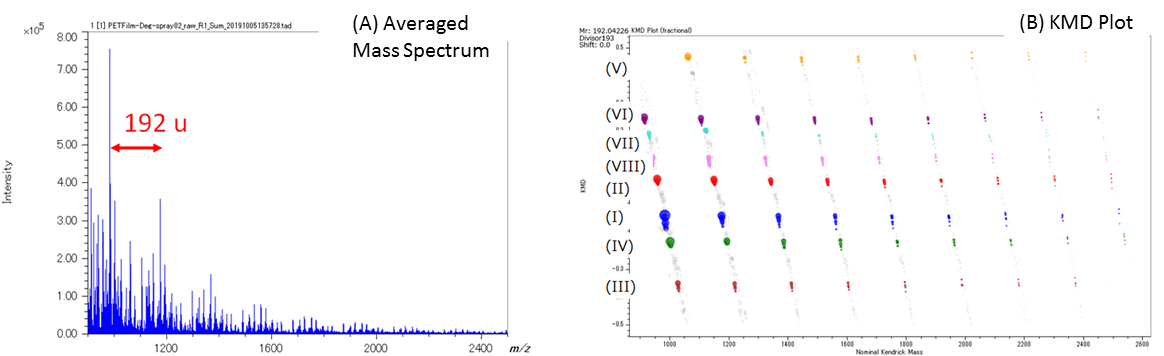
Figure 3. (A) Averaged mass spectrum for the MSI measurement region and (B) KMD plot (base unit C10H8O4, X=192). The KMD plot easily showed the presence of eight PET series (I) – (VIII).
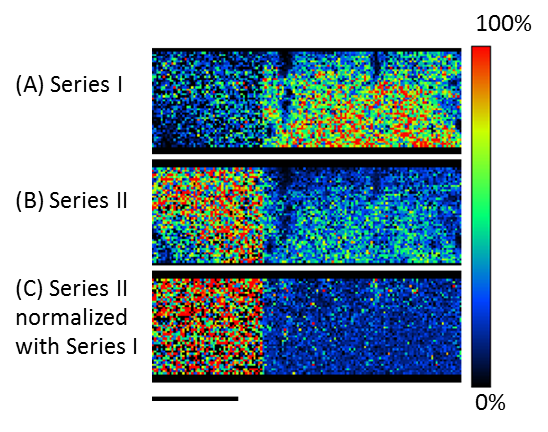
Figure 4. Images of (A) the cyclic oligomer of PET series (Series I), (B) the ultraviolet degraded PET polymer series (Series II), and (C) Series II normalized to Series I.
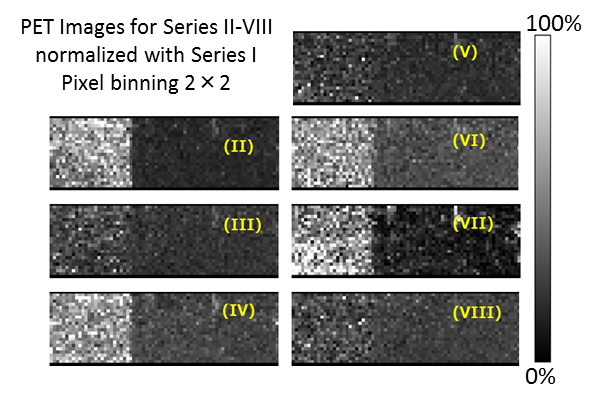
Figure 5. The PET Series II –VIII images normalized with the Series I image.