MSTips No. 306
A mass spectrometry imaging method for visualizing synthetic polymers combined with Kendrick mass defect analysis
Product: JMS-S3000
Introduction
Matrix assisted laser desorption/ionization (MALDI) mass spectrometry is a powerful tool for the analysis of synthetic polymers. This technique, when combined with a high-resolution time-of-flight mass spectrometer, can be used to identify differences in monomer, polymer end groups, and their molecular weight distributions. The molecular weight distribution is often expressed as number average molecular weight (Mn), weight average molecular weight (Mw), and dispersity (D). More recently, MALDI mass spectrometry imaging (MALDI-MSI) has been used to visualize the locations of compounds on sample surfaces. However, this technique has not been widely used for polymer analysis. One reason for this is that polymers have molecular weight distributions which means that mass images based on specific degrees of polymerization (specific m/z value typically used by conventional methods) do not necessarily express a clear picture for the full polymer localization. In the previous MSTips 305 report [1], we proposed a new MALDI-MSI visualization method for synthetic polymers that used the Mn, Mw and D as indices. In this report, we have combined this method with the Kendrick Mass Defect (KMD) method to effectively visualize polymer series mixtures.
Experimental
A model sample was prepared using polyethylene glycol (PEG), polyethylene glycol monododecyl ether (PEG-C12H25), and polypropylene glycol (PPG) .The reagents used are shown in Table 1. A mixed solution of PEG, PEG-C12H25, α-CHCA, and NaTFA 1/0.1/10/1 (v/v/v/v) was spotted on the left-hand spot, and a mixed solution of PEG, PPG, α-CHCA, and NaTFA 1/0.1/10/1 (v/v/v/v) was spotted on the right-hand spot (Figure 1). The MALDI-MSI data was measured by using the SpiralTOF positive ion mode on the JMS-S3000. The pixel size was 50 μm, and the laser irradiation frequency was 50 times for each pixel. The MSI analysis and visualization was performed by using the JEOL msMicroImager™ software, and the KMD analysis was performed by using the JEOL msRepeatFinder™ software.
| Samples |
Polyethylene glycol (PEG) Mw2000
Polyethylene glycol monododecyl ether (PEG-C12H25)
Polypropylene glycol (PPG) Mw 2000
1mg/mL (in MeOH)
|
| Matrix |
α-CHCA 10mg/mL (in MeOH)
|
| Cationization |
NaTFA 1mg/mL (in MeOH)
|
Table 1. Samples, matrix and cationization agent.
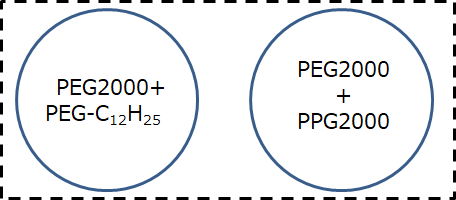
Fig. 1. Schematic of the model sample.
Results
The average mass spectrum for the entire sample region (right-hand and left-hand spots) is shown in Figure 2A. Two polymer distributions with repeat units of 44 u (C2H4O) were easily observed around m/z 900-1800 and m/z 1500-2800 that corresponded with PEG-C12H25 and PEG 2000, respectively. However, the polypropylene series with repeat units 58 u (C3H6O) was more difficult to observe in the average mass spectrum. The C2H4O KMD plot for the average mass spectrum is shown in Figure 2B. This plot clearly showed the presence of three polymer series as highlighted by the three colors (blue, red, and green). The two major series for PEG2000 (colored with blue) and PEG-C12H25 (colored with red), which both have C2H4O monomer units, made a horizontal line across the KMD plot. The minor series for PPG2000 (colored with green) showed a sloped line due to the fact that it has a repeat unit of C3H6O. These results clearly show the advantage of using a KMD plot to easily visualize polymer series, even with low intensity ions that can be difficult to observe in the mass spectrum. Using the KMD plot, three polymer peak lists were extracted from the average mass spectrum peak list and images for Mn and D were made for each polymer series. The PEG, PEG-C12H25 and PPG polymer peak lists contained 216, 84, and 70 peaks, respectively. It would be time consuming to use conventional methods that involve looking at all 370 mass images individually to make any reasonable determinations about the samples. However, the Mn and D were easily calculated using each extracted peak list. The corresponding Mn and D images for each polymer series are shown in Figure 3. From these images, the Mn values of PEG, PEG-C12H25 and PPG were approximately 2200, 1350 and 2200, respectively, and the D values of PEG, PEG-C12H25 and PPG were approximately 1.01, 1.015 and 1.008, respectively.
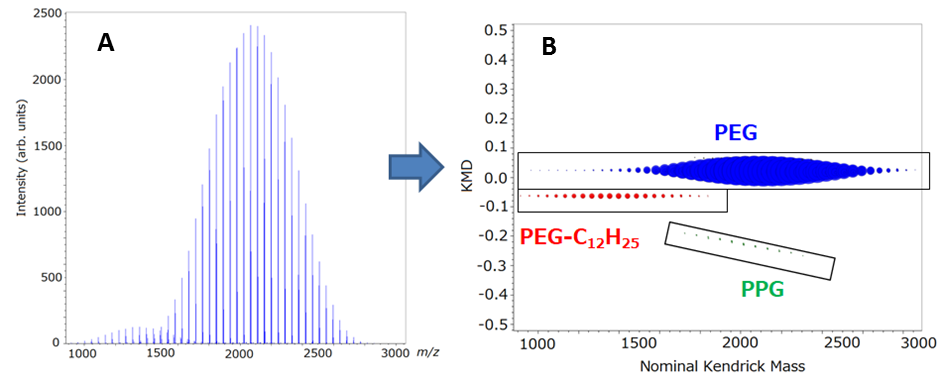
Fig. 2. (A) Averaged mass spectrum showing two clearly defined polymer series with a repeat unit of 44 u (C2H4O). (B) KMD plot (based on C2H4O) for the entire peak list from the averaged mass spectrum. The PEG and PEG-C12H25 polymer series were observed as horizontal lines across the plot. Also, the PPG series that was difficult to find in the mass spectrum is clearly observed in the KMD plot.
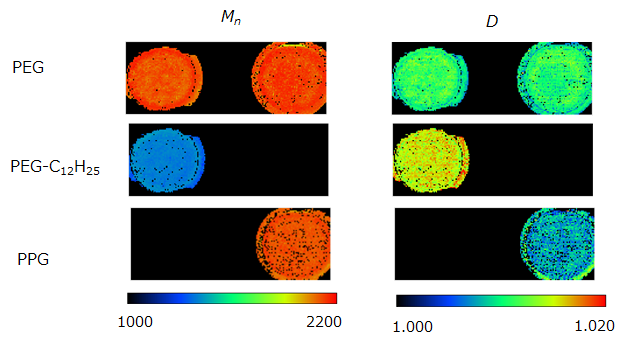
Fig. 3. The Mn and D images for PEG, PEG-C12H25 and PPG polymer series.
Conclusions
In this report, we have introduced the advantages of combining KMD analysis with the visualizing method reported in MSTips 305 to analyze samples containing multiple synthetic polymer series. By using the KMD method, it is easy to visualize each polymer series, even for minor components that are difficult to identify in the mass spectrum.
References
- [1]MSTips 305 A mass spectrometry imaging method for visualizing synthetic polymers by using average molecular weight and polydispersity as indices.