Applications Note: NM250004E
Currently, JASON1 SMILEQ2 supports the generation of two types of analytical reports based on quantitative analysis results. These reports offer comprehensive insights into the interpretation of quantitative data. This application note focuses on the impact of standard sample uncertainty, a key factor, and presents the results of a more detailed analysis of uncertainty factors conducted using the findings obtained in Part 1 and Part 2.
How Does the Uncertainty of Standard Samples Impact Quantitative Analysis Results?
Uncertainty Report and ANOVA Report Results
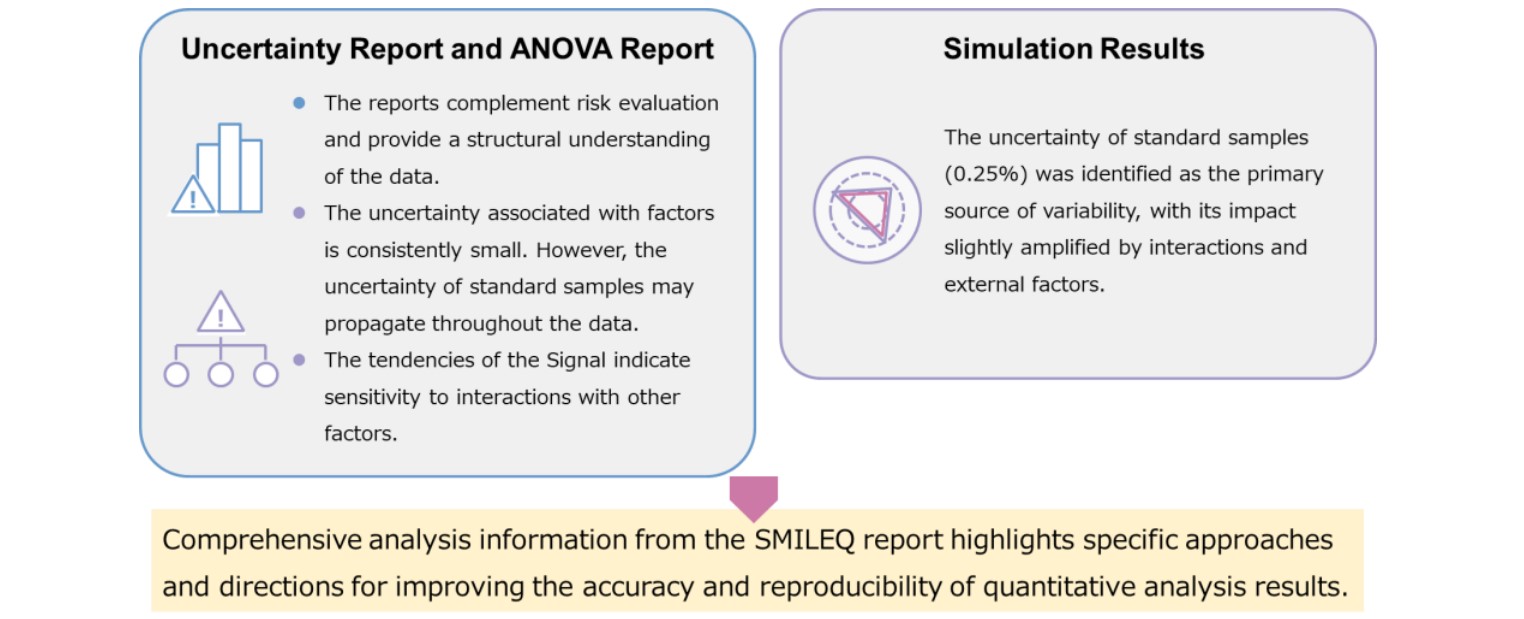
From the previous analysis, it has been confirmed that repeated errors across the entire measurement system are very small, demonstrating the stability of the measurement process. On the other hand, it is suggested that the uncertainty associated with standard samples may propagate throughout the measurement results.
Analyzing the Impact of Standard Sample Uncertainty
Standard samples are often difficult to substitute, and there are challenges in directly testing their uncertainty impact on measurement results through experimentation. To address these challenges, detailed analyses using simulations prove effective. In this study, computational methods were employed to clarify the tendencies of uncertainty caused by standard samples affecting measurement results.
Analysis Method
The influence of standard sample uncertainty on the integral values obtained through experiments and the resulting quantitative values was investigated. This analysis employed the following methods to examine the impact in detail. Calculations were performed using PythonⓇ3 and the report data.
-
Analysis of Coefficients of Variation: The standard deviation (SD) and coefficient of variation (CV) of integral and quantitative values in experimental data were compared to assess the impact of standard sample uncertainty on the data.
-
Analysis Using Sensitivity Coefficients: Simulations based on sensitivity coefficients were conducted to analyze the effects of standard sample uncertainty.
-
Analysis Using Monte Carlo Method: The Monte Carlo method was employed to simulate the influence of uncertainty on the entire measurement and to analyze the detailed characteristics of data distribution.
1. Analysis of Coefficients of Variation
Coefficient of Variation (CV)
The coefficient of variation is a metric that expresses the variability of data relative to the mean. It is calculated by dividing the standard deviation by the mean and is typically displayed as a percentage. This metric is effective in assessing the variability of measurements and serves as an important tool for determining the stability of measurement systems.
Coefficient of Variation After Quantitative Calculations
Figure 1 compares the standard deviation and coefficient of variation for integral values (Non-Normalized) and quantitative values (Normalized) before quantitative calculations. Both sets of values were normalized using their average values to analyze variations more effectively. This approach focused on examining the amplitude of fluctuations and ensured a consistent basis for comparison. After the calculations, the coefficient of variation was found to be as small as 0.21%, confirming that these corrections successfully reduced data variability. Additionally, it was suggested that the final quantitative values might be highly dependent on the characteristics of the standard samples.
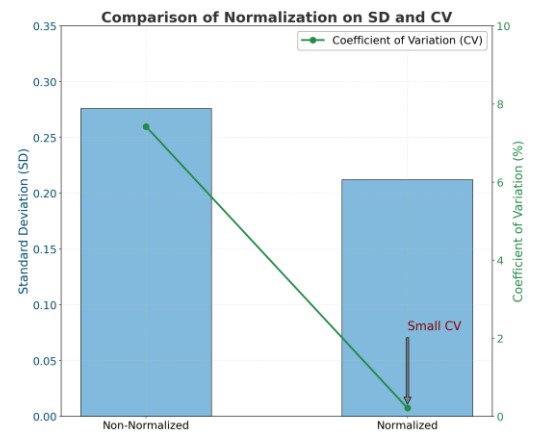
Figure 1. Comparison of Standard Deviation and Coefficient of Variation
2. Analysis Using Sensitivity Coefficients
Sensitivity Coefficient
The sensitivity coefficient is a quantitative metric that indicates the extent to which each factor impacts measurement or calculation results. Specifically, it is used to assess how small variations in individual factors contribute to the outcomes. By utilizing this metric, critical factors within a system or analytical model can be identified. Below, the significance and details of simulations based on sensitivity coefficients are explained.
Significance of Simulations Utilizing Sensitivity Coefficients
By applying sensitivity coefficients in simulations, it becomes possible to effectively quantify how specific factors influence the results. In this study, the contribution of standard sample characteristics to overall measurement results was assessed, and their tendencies were clarified.
Simulation Results Using Sensitivity Coefficients
Simulation Range
Simulations were conducted to evaluate the impact on quantitative values when the uncertainty of standard samples (0.25%) fluctuated within its surrounding range.
Simulation Results
From the simulations, the average values and standard deviations of the quantitative values were calculated (Figure 2 (a)). Figure 2 (b) presents a plot comparing the standard deviations of the quantitative calculation results and simulation results against the integral values of the standard samples in the experimental data. The trends in standard deviation were consistent with the experimental results, confirming the accuracy of the simulation's approach.
Characteristics of Experimental Results
The experimental results showed slightly higher values compared to the computational model results, suggesting the possible influence of other factors. Below is an explanation of the impacts of the uncertainties under consideration on the simulation:
- Characteristics of Small Uncertainty Ranges
A narrow uncertainty range implies that the variability captured by the model is minimal, making the contribution of specific factors more prominent. In scenarios dominated by the uncertainty of standard samples, external factors are more likely to have a significant impact within this limited range of variability.
- Impact on Model Responsiveness
In modeling with small uncertainty ranges, the sensitivity coefficient may not fully reflect the variability. Specifically, the extent to which the model can account for external factors becomes a critical point. Simulations capable of appropriately reproducing the cumulative effects of small fluctuations are more likely to exhibit realistic behavior, even within a narrow range of uncertainty.
Conclusion and Model Applicability
In cases where the uncertainty range is small, the sensitivity and corrections of the model play a crucial role. However, when accounting for complex external factors and interactions, comprehensive methods like the Monte Carlo approach may prove more effective. Especially when experimental data exhibits higher variability or deviation than the model, using such comprehensive methods enables modeling that aligns more closely with the experimental environment.
3. Analysis Using Monte Carlo Method
Overview of the Monte Carlo Method
The Monte Carlo method is a technique that combines random sampling with statistical methods to analyze complex problems. By repeatedly performing numerous simulations based on the distribution of input variables, it identifies the distribution and tendencies of the output results. This method is particularly useful in the following ways:
-
Reproducing the Behavior of Complex Systems: Capable of analyzing overall behavior even in scenarios involving numerous factors.
-
Evaluating Uncertainty: Examines in detail how uncertainty impacts results.
-
Analyzing Entire Distributions: Allows for a visual understanding of not only mean values but also variability and ranges of output results.
Below, we explain the significance and details of simulations utilizing the Monte Carlo method.
Significance of Simulations Using the Monte Carlo Method
The Monte Carlo method was employed to analyze the impact of standard sample uncertainty on the variability and distribution of measurement results. This approach clarified not only the mean values and standard deviations but also the range and shape of variability in measurement results, enabling a comprehensive understanding of the overall data distribution. Additionally, the contributions of standard samples to the stability of the measurement system were quantitatively evaluated, providing direction for improving reliability.
Simulation Results Using the Monte Carlo Method
Simulation Range
Simulations were conducted to evaluate the impact on quantitative values when the uncertainty of standard samples (0.25%) fluctuated around the baseline. The ranges of variation included ±0.05% (i.e., 0.20%-0.30%) and ±0.10% (i.e., 0.15%-0.35%).
Modeling and Statistical Evaluation of Uncertainty
Uncertainty was analyzed using probabilistic models to assess the trends in data distribution. The variations of standard samples were statistically reproduced using uniform distributions and Gaussian distributions (normal distributions), and these results were compared with experimental data. Figure 3 shows a plot comparing the calculated results with experimental results: (a) Distribution of quantitative values. (b) Comparison of normalized mean values, standard deviations, and coefficients of variation.
Evaluation Methods for Simulation Results
To evaluate the simulation results, the most realistic model was considered by calculating the following score. This score was computed as a metric to quantify the variability of measurement results and is based on the formula:
(Score) = (Mean Difference (%) + SD Difference (%) + CV Difference (%)) /3
-
Mean Difference (%) Evaluates the difference between the average values of experimental results and simulation results, indicating the overall alignment.
-
SD Difference (%) Assesses the difference in standard deviations between experimental data and simulation data, measuring the degree of alignment in variability.
-
CV Difference (%) Evaluates the difference in coefficients of variation, focusing on relative variability in the data.
By integrating these three differences and calculating the average, the score was determined. This score is effective for comprehensively evaluating data alignment and the impact of uncertainty.
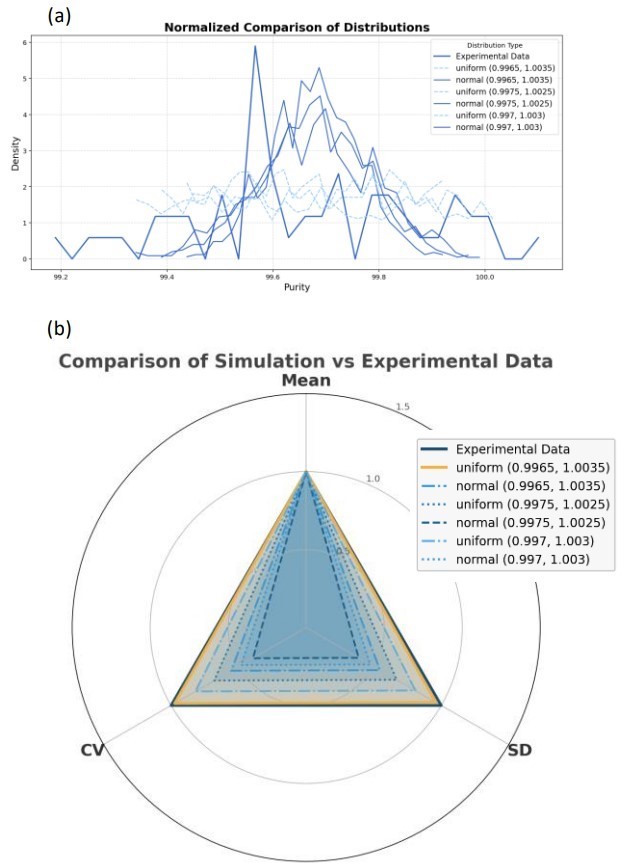
Figure 3. Simulations Using the Monte Carlo Method: (a) Simulation results (b) Comparison of mean values, standard deviations, and coefficients of variation
Most Consistent Model
A uniform distribution within the uncertainty range of 0.35% (0.9965 to 1.0035) achieved a score of 2.05%, confirming it as the best fit to the experimental data. Figure 4 shows a plot comparing the simulation results and experimental results at an uncertainty of 0.35%. The results are interpreted as follows:
-
Uncertainty Range of Standard Samples
Although an uncertainty of 0.25% was set as the theoretical standard, the simulation results demonstrated that a range of 0.35% was the most consistent with the experimental data. This difference suggests that the uncertainty of the standard samples may propagate as an error factor throughout the experiment.
-
Analysis of Distribution Shape
The better fit of the uniform distribution compared to the Gaussian distribution implies that the experimental environment lacks significant variations. In scenarios where a uniform distribution is a better fit, it is likely that the environment and processes are relatively stable, with variations confined to a consistent range.
-
Ripple Effects and Error Factors
The simplicity and uniformity of fluctuations in the overall experimental system suggest that the uncertainty of standard samples directly impacts the variability of measurement data, reflecting it as an overall error factor.
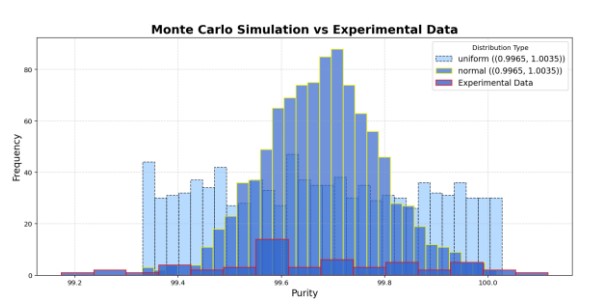
Figure 4. Comparison of Data Distribution and Experimental Results within a 0.35% Uncertainty Range
Summary of Simulation Results Using Sensitivity Coefficients and the Monte Carlo Method
Differences in Approaches
The sensitivity coefficient was utilized as a method to locally quantify the contribution of standard samples and to analyze in detail the impact of specific factors on measurement results. This approach focuses on particular factors and evaluates their influence in depth. On the other hand, the Monte Carlo method comprehensively analyzes the random behavior of multiple factors, aiming to reproduce the overall behavior of measurement results. It emphasizes visualizing overall distributions and ripple effects.
Differences in Objectives
The objective of sensitivity coefficient analysis was to locally evaluate the influence of specific factors on measurement results. This analysis clarified the extent to which standard sample uncertainty contributes to the results. Conversely, the Monte Carlo analysis aimed to reproduce the overall distribution of measurement data and to examine the ripple effects of uncertainty, as well as the potential influence of external factors and interactions beyond the standard samples.
Overall Conclusions
The simulation results using sensitivity coefficients indicated that the uncertainty of standard samples significantly impacts the overall trend of uncertainty in measurement results. Additionally, the results suggested that external factors and interactions, beyond standard samples, might slightly influence the measurement outcomes. The Monte Carlo results showed that a uniform distribution with an uncertainty of 0.35% (0.9965–1.0035) best fit the experimental data. This finding revealed that the uncertainty of standard samples (0.25%) is a primary source of variability, while its effects are slightly amplified by other factors. Moreover, the suitability of a uniform distribution suggests that the overall experimental environment is relatively simple and exhibits stable fluctuations within a defined range.
SMILEQ Report: Summary of Uncertainty Factor Analysis
Based on the results of the uncertainty report and ANOVA report, the primary factors affecting quantitative analysis results were analyzed. Additionally, simulations were utilized to conduct a detailed analysis of uncertainty factors. In particular, the SMILEQ report's indications regarding the impact of standard sample uncertainty were reproduced, allowing for a more quantitative evaluation of its contribution to overall measurement results. Although evaluations of results influenced by extended uncertainty have been conducted previously, there are few cases where additional factor analysis has clarified the underlying causes. From the findings of this report, it is demonstrated that comprehensive analysis using the SMILEQ report provides specific methods and directions for improving the accuracy and reproducibility of quantitative analysis.
[1] JEOL Analytical Software Network
[2] Spectral Management Interface Launching Engine for Q-NMR
[3] Python is a registered trademark of the Python Software Foundation.